
Introduction: No More Guessing; See What Your Users Are Doing
Most websites do not lack SEO, they lack user insight. Driving traffic from keywords, backlinks and writing are important, however, if your visitors fail to engage on a site, you will see a slow, but steady decline in your rankings. This is because today’s modern search engines are placing higher importance on the signals of user experience, more than ever before.
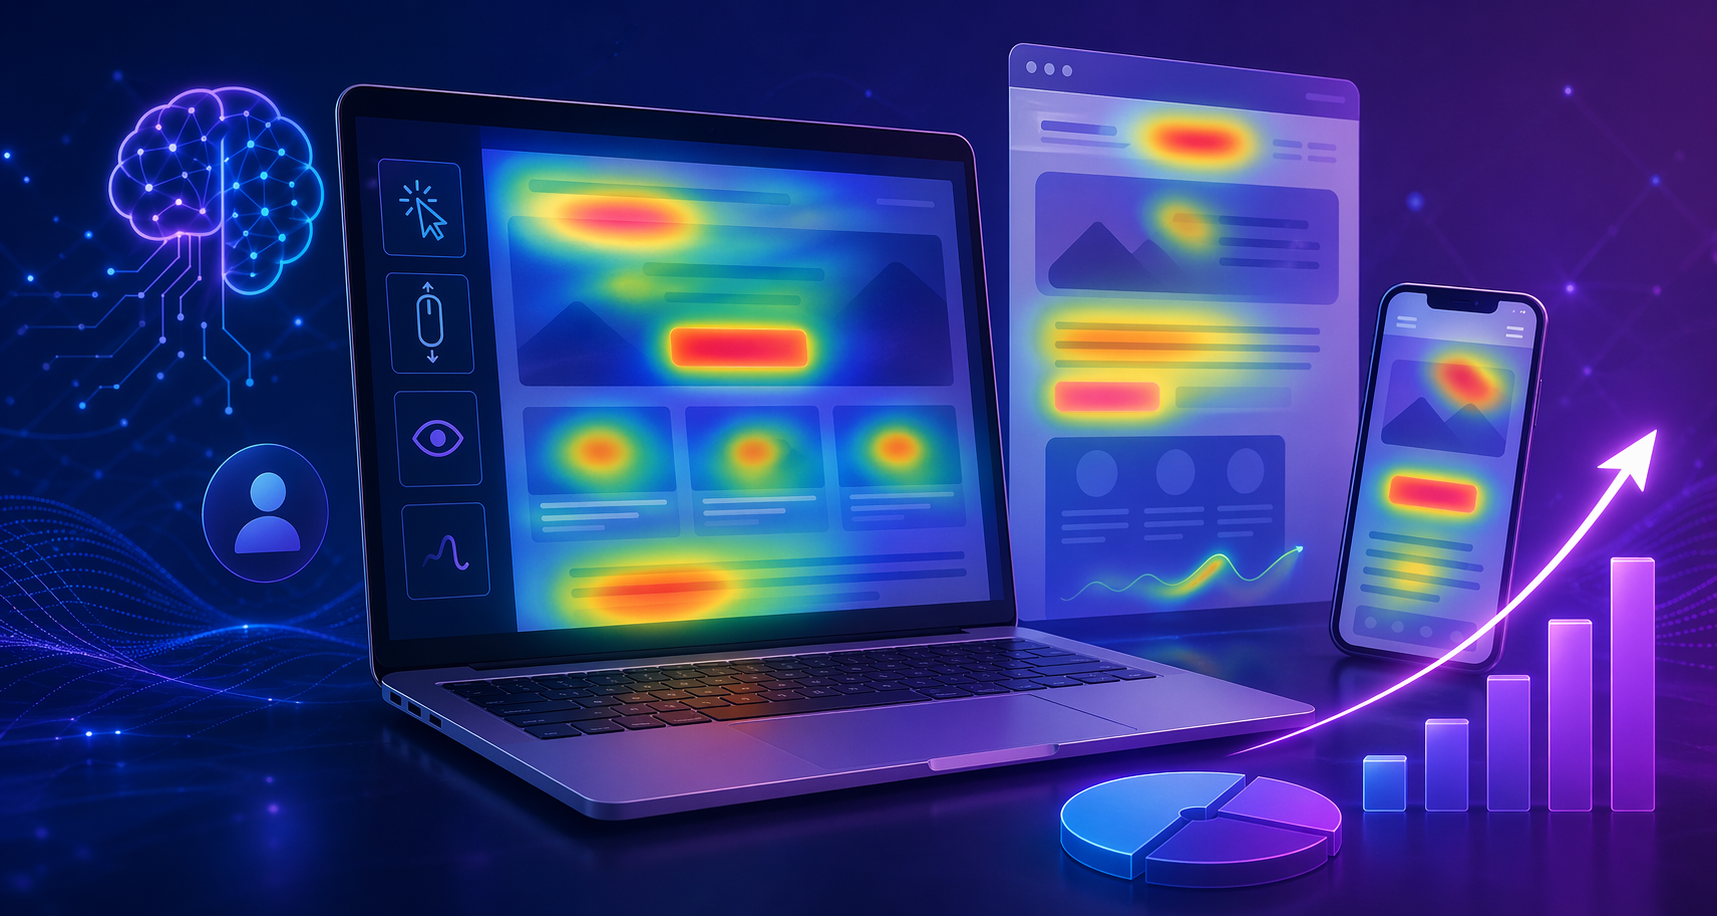
This is where the use of AI Heatmaps and UX Optimization play a big role in a website’s success. By utilizing AI Heatmaps, you will visually and analytically understand your users on an exact, quantifiable basis, which will enable you to determine where on your web page users are clicking, scrolling, stopping, and/or abandoning your web page.
Through this detailed guide, you will learn how to implement AI Powered Heat Maps into your UX Conversion Strategy, and how by Improving Your UX, you will Increase Your Engagement Metrics, Ultimately Providing You with the Tools to Boost Your Rankings, with Certainty and Confidence.
Definitions of AI Heatmaps (A Brief Explanation)
AI heatmaps are sophisticated visual tools that can monitor and study how users behave on websites and employ artificial intelligence to detect patterns and forecast actions.
Heatmaps are data interpretation techniques that convert standard web analytics into easy-to-read graphics and images instead of a standard web analytics report which contains mostly numbers.
What is Listed on an AI Heatmap?
Places Where Users Click Most Often
How Much Users Scroll Down a Web Page
Where Users Are Attracted to Certain Areas
Locations on the Page Where Users Hesitate or Drop Off
Types of Heatmaps to Utilize
Click Heatmap – Provides a visual representation of where users click on a webpage in order to gauge user engagement and their navigation style.
Scroll Heatmap – Displays how far users have scrolled down a webpage and identifies locations where the attention of the users has lapsed.
Hover Heatmap – Utilizes mouse movement as an indication of what is attracting user attention on a webpage.
AI Attention Heatmap – Uses machine learning and the collection of minimal data to forecast where users are most likely to concentrate their attention before large amounts of data are collected.
The Most Important Part: AI heatmaps not only track user behavior but also provide insight into the meaning of that behavior, along with recommendations for improvement.
Why AI Heatmaps are Important for SEO and Rankings
The focus of search engines, like Google, is on providing a good user experience.
User experience metrics include:
Bounce Rate
Dwell Time
Click Through Rate (CTR)
Interaction Depth
Core Web Vitals
The SEO Impact Loop:
Better user experience = better engagement = better user behaviour signals = better position/ranking on search engine results pages (SERPs).
Impact of Heatmaps on Above-Mentioned KPIs:
Bounce rate reduction: Discover problem areas
Dwell time increase: Optimize the content flow
CTR improvement: Optimize the placement of calls-to-action
Conversion rate increase: Proper placement/positioning of products
As a result, AI heatmaps assist in aligning the website according to what both users and search engines want.
How AI heatmaps enhance optimization for the user experience (step-by-step).
1. Identify dead zones within the website.
The dead zone is where customers tend to ignore the information that is not relevant to them, as well as sections that do not attract their attention for any visual reason. For example, if there is an important part of the website that is out of view, customers will not notice it.
To fix this:
Make sure key elements are moved up on the page
Provide visual contrast, such as using different colours or buttons,
Include visual cues, such as directional arrows or icons
2. optimize your above-fold page for immediate interaction.
The area above the fold is where the user will make a decision on whether or not to stay or leave the site after just a few seconds.
AI heat maps will allow you to see:
How many users are interacting with the site immediately when they land on it – and/or,
If someone has scrolled down to some part of the page and never interacted.
Best practices will include:
Presenting a clear and concise headline that conveys the benefits of what you are providing,
Presenting a subheading that emphasises what the headline has stated,
Use clear and visible call-to-action (CTA),
Keep your page uncluttered with multiple images or obstacles.
3. Enhance readability and structure of your content.
The scrolling heat maps will show you precisely where your customers have stopped reading.
If your customer has stopped reading:
Your content may have too many words with no breaks in between
Your content may be hard to read because of conflicting formats
Your content may not relate to what your customer wants to know.
For fixing this problem effectively:
Maintain small paragraphs (up to three to four lines only).
Include frequent sub-headings.
Incorporate bullet points along with distinctive keywords.
Distribute difficult information among various sections.
4. Do not Complicate through Hidden User Experience Aspects
While doing heatmap analysis, rage clicks are among the most commonly unidentifiable data points.
Meaning of Rage Clicks:
The user wants to click on something but is unable to do so.
Why It’s Important:
It creates irritation for the user
It leads to an increase in bounce rate
It impairs trust in the brand
Ways to Resolve This Issue:
Make your buttons visually distinguishable
Utilize a consistent layout for each design
Avoid using UIs that could mislead users
5. Position your Call to Actions in Optimal Locations for Higher Success Rates
Heatmaps help determine the location of maximum concentration, and this is where CTAs should go.
Helpful Tips for Successful Call to Action Placement:
Place CTAs in mid-content (after you’ve delivered value to the user)
Always have CTAs above the fold
Place them at natural points of decision making
👉 Helpful Hint: Reach the optimum position based upon actual user activity instead of an aesthetic preference.
AI Heatmaps vs Traditional Analytics: Why Visualization Wins
Feature | Traditional Analytics | AI Heatmaps |
Data Format | Numbers & charts | Visual overlays |
Insights | Surface-level | Deep behavioral |
User Intent Understanding | Limited | High |
Actionability | Manual interpretation | AI-driven suggestions |
Insight: Analytics tell you what happened.
AI heatmaps tell you why it happened—and how to fix it.
Best AI Heatmap Tools for UX Optimization
Here are some industry-leading tools:
Top Tools:
Hotjar – Suitable for both new and experienced users.
Microsoft Clarity – Cost-free but very effective.
Crazy Egg – Very aesthetically pleasing data on user interaction.
FullStory – Provides enterprise-level analytics.
Smartlook – Records of user sessions and heatmap creation.
Elements to Look For When Choosing Your Tool:
Suggestions from AI
Ability to recording sessions
Reporting within funnels
Mobile heatmaps
Ease of integration
Real-World Case Study: Turning Insights Into Rankings
Case Study on Using Heatmaps for Improved Ranking Already Having High Traffic to a SaaS Web Site With Low User Engagement and Low Conversion Rate.
When Reviewing The Web Site’s Heatmaps, We Found:
No visitors scrolled past 40% of the page.
Location of call to action was too low on the page.
Message of the value proposition was not clearly communicated.
The Changes Made To The Web Site:
Headline Rewritten
Move the call to action above the fold
Added hierarchy to images and text
Reduced overall content volume
The Results Achieved:
+38% Increase In User Engagement
+22% Increase In Conversion Rate
Longer Dwell Time On Site Resulting In A Significant Improvement In The Search Engine Ranking Of The Site.
Advanced Techniques: Using AI Heatmaps Like a Boss
1. Pair Heatmaps With SEO Information
Utilize tools, such as Google Search Console and Google Analytics.
Strategy:
Locate pages that have high impressions but very little engagement until you can use heatmaps to identify any problems and improve the UX.
2. Forecast Users’ Actions Using AI
The latest generation of heatmaps can:
Show areas where users pay attention.
Propose modifications to layout, and
Show areas where there is friction.
This can allow you to optimize even before you have a lot of traffic.
3. Conduct Data-Driven A/B Tests
Rather than rely on intuition:
Use heatmap data to design your tests.
Use this data to evaluate the success of each design,
Using the data to implement your designs across the site.
4. Create Content for Mobile-First Users
Users will behave differently on a phone than on a computer.
Typical Problems:
Buttons are too small.
Content is too tightly spaced.
Scrolling issues.
Solutions:
Use mobile heatmaps to ensure that tap areas are logically placed.
Utilize mobile heatmaps to locate problems with your tap areas.
Remove layout elements that make it difficult to navigate the content.
5. Match the User Experience with the User’s Search Intent
Regardless of how much UX is improved, it will still fail if it does not align with the purpose of the user.
Example:
An informational blog requires easy-to-read text
More conversions on a service page require proper user guidance
Use heatmaps to verify that users can achieve their objectives.
Common Mistakes to Avoid in Your SEO Campaign
Lack of Attention to Mobile User Behavior
Over-Analyzing without Taking Action
Making Too Many Changes at Once
Only Looking at Clicks (Not Scroll Depth)
Not Testing Your Changes After Implementation
Knowledgeable Insights to Help You Gain an Edge
Users Often Scan in the “F” Pattern, So Layout Should be Set up Accordingly
Visual Hierarchy has More Weight on User Engagement than Content Length
Micro-Interactions (Button and Hover Effects) Will Impact User Behavior
White Space Will Help Improve Readability & Retention
Over Time, Small Adjustments Can Create a Massive Impact on SEO.
Frequently Asked Questions about Heatmaps (FAQ)
1. What are AI heatmaps and how do they work in SEO?
AI heatmaps visually display user actions on a website, providing insights to improve user experience (UX) and search engine optimization (SEO) performance.
2. How do heatmaps help SEO?
Heatmaps improve key engagement metrics (dwell time, click-through rate), which directly influence SEO ranking.
3. Are heatmaps more effective than traditional web analytics?
Heatmaps provide visual and behavioral analytics that enhance traditional web analytics and allow for a deeper understanding of user experience.
4. What’s the best heatmap for beginners?
Microsoft Clarity and Hotjar are two great options for beginners.
5. Do heatmaps increase conversion rates?
Yes, by optimizing layout, CTA placement, and user flow based on actual data.
6. Do heatmaps help reduce bounce rates?
Yes, heatmaps allow you to identify and resolve user experience issues resulting in high bounce rates.
7. Are heatmaps effective for mobile optimization?
Yes, heatmaps are fundamental to improving mobile-friendly user experience and increasing user engagement.
8. How often should I evaluate my heatmaps?
You should evaluate your heatmaps on a monthly basis or after making any major updates to the website.
Conclusion: Turn User Behavior Into Ranking Power
If you’re still relying on guesswork, you’re missing one of the biggest SEO advantages available today.
AI heatmaps & UX optimization allow you to transform raw user behavior into strategic improvements that directly impact rankings.
When you understand how users interact with your site, you can:
- Improve engagement
- Increase conversions
- Strengthen SEO signals
👉 The future of SEO isn’t just keywords—it’s user experience backed by data.
Ready to Take Action?
Start leveraging AI heatmaps today—or partner with experts who can turn your website into a high-performing, conversion-driven asset.


